8.2.4 Interpretation and representation of the results
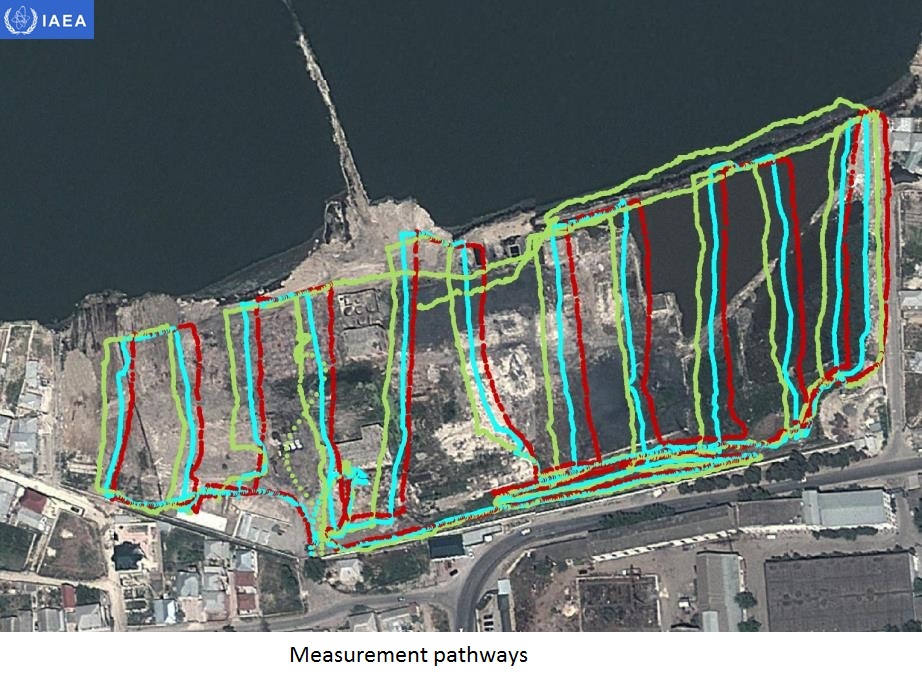
The most common way to present data is in a surface map form, using Geographic Information Systems (GIS). A map format can include topography, representation of surface water flows, buildings, highways, known mines and so forth as background picture to give the environment context of measures and results. Data must be analyzed to produce maps by interpolation of the results between data points in the areas where sufficient measurements have been done, so inferences should not be made in the maps in areas for which there are not sufficient measurements.